14,144 people died by suicide last year; more than half of all deaths among those in their teens and 20s
Cancer deaths up 1.6%; sepsis rises to 8th; dementia mortality up 9.2%
Maternal mortality exceeds OECD average; infant mortality falls 14.9%

South Korea's suicide rate fell 4.7 percent last year compared with the previous year, yet suicide remained the leading cause of death for every age group from teenagers through people in their 40s. More than half of all deaths among those in their teens and 20s were attributed to suicide.
The dementia mortality rate rose 9.2 percent, and sepsis climbed two spots to rank eighth among causes of death. The maternal mortality ratio — deaths related to pregnancy and childbirth — rose 28.8 percent, surpassing the OECD average.
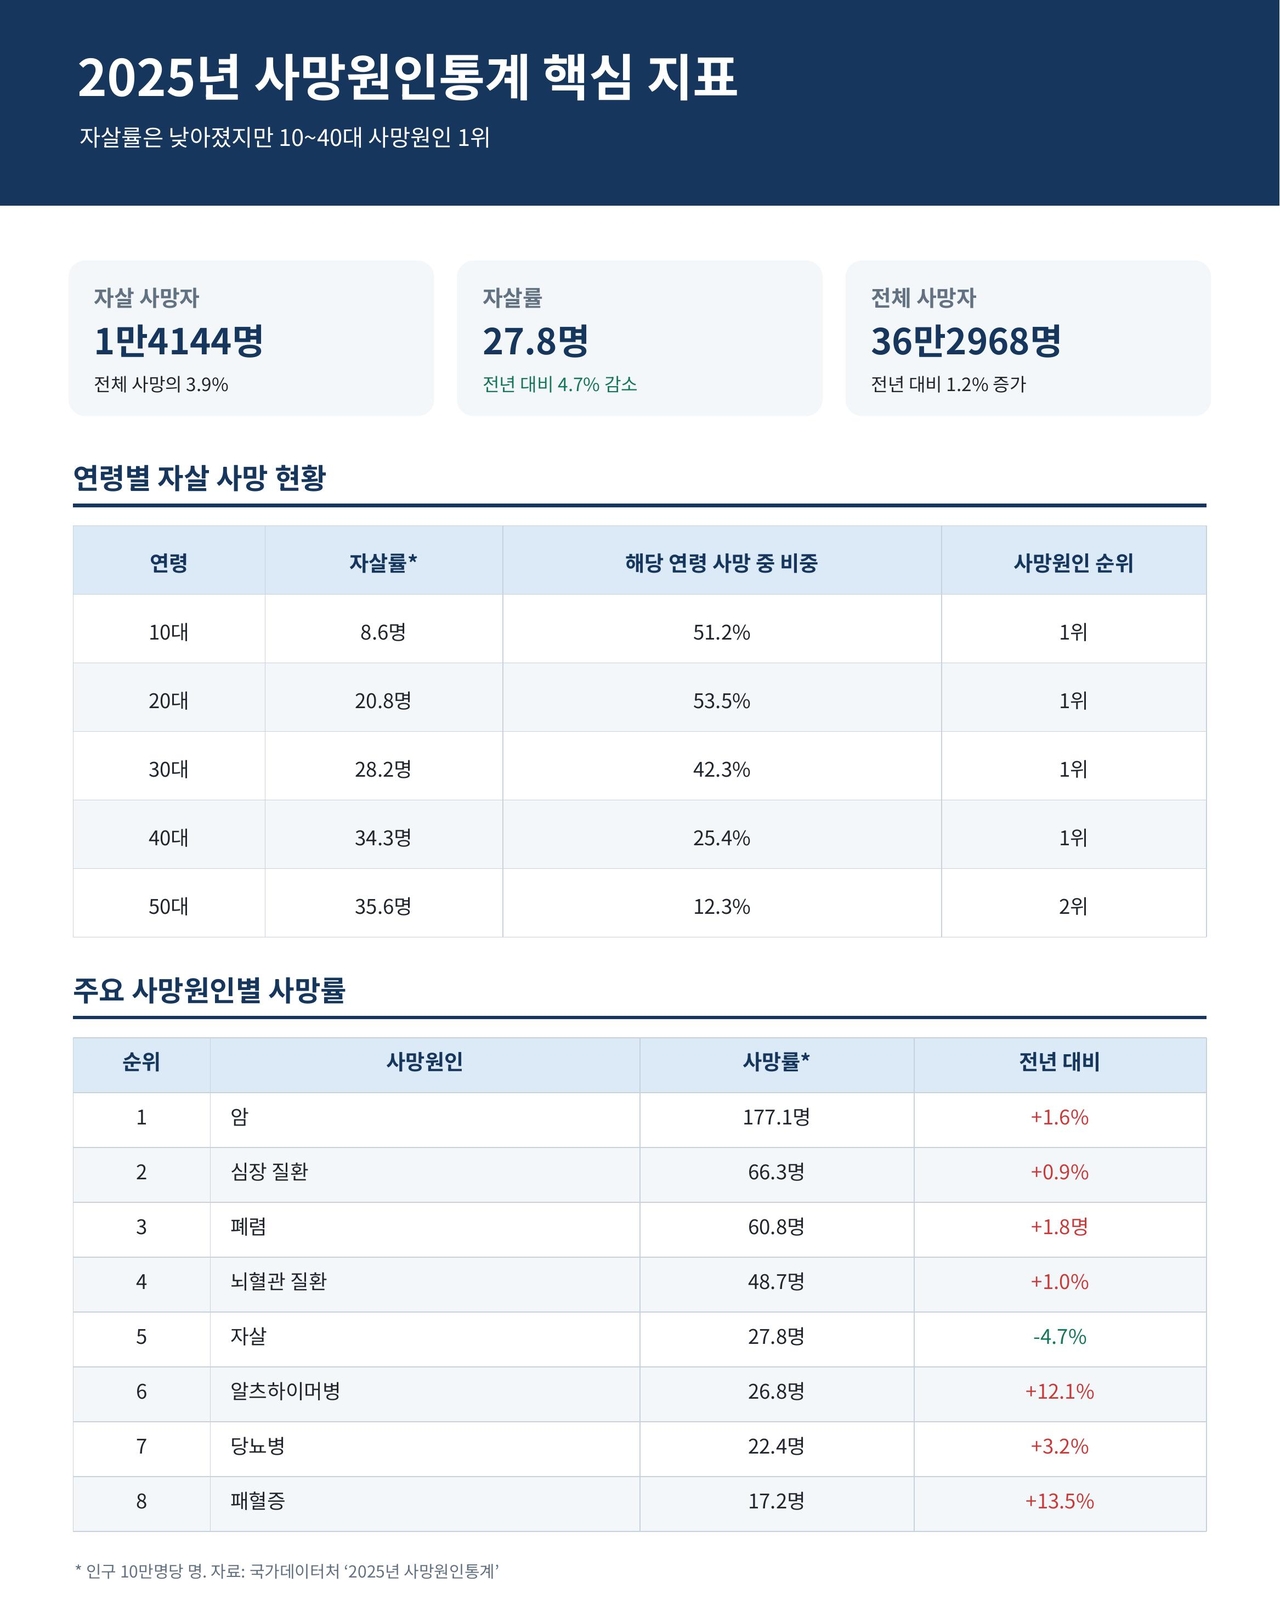
According to the "2025 Cause-of-Death Statistics" released Tuesday by the Ministry of Statistics, 14,144 people died by suicide last year, accounting for 3.9 percent of all deaths.
The suicide rate — measured as deaths per 100,000 people — stood at 27.8, down 1.4 (4.7 percent) from the previous year. The male suicide rate was 39.7 and the female rate was 16.0, meaning men died by suicide at roughly 2.5 times the rate of women.
Suicide rate declines, but accounts for more than half of deaths among teens and those in their 20s
Even as the overall suicide rate declined, suicide continued to weigh heavily on younger age groups. It was the leading cause of death for every age bracket from the teens through the 40s.
The suicide rate by age group was 8.6 per 100,000 for those in their teens, 20.8 for those in their 20s, 28.2 for those in their 30s, and 34.3 for those in their 40s. Suicide accounted for 51.2 percent of all deaths among teenagers, 53.5 percent among those in their 20s, 42.3 percent among those in their 30s, and 25.4 percent among those in their 40s.
From the 50s onward, cancer overtook suicide as the top cause of death. However, suicide remained the second-leading cause among people in their 50s, with a rate of 35.6 per 100,000 — representing 12.3 percent of all deaths in that age group.
Total deaths last year reached 362,968, up 4,399 (1.2 percent) from the previous year, an average of 994 deaths per day. Male deaths numbered 193,547 and female deaths 169,421, rising 0.9 percent and 1.6 percent, respectively.
The crude death rate — deaths per 100,000 people — rose 1.4 percent to 712.6. People aged 80 and older accounted for 54.7 percent of all deaths, up 13.9 percentage points from a decade ago.
By contrast, the age-standardized mortality rate, which removes the effect of an aging population structure, fell 9.3 to 285.3 per 100,000. While total deaths and the crude death rate rose as the elderly population grew, the overall risk of death within each age group declined.
The top 10 causes of death last year were cancer, heart disease, pneumonia, cerebrovascular disease, suicide, Alzheimer's disease, diabetes, sepsis, hypertensive disease and liver disease, in that order. These 10 causes accounted for 67.2 percent of all deaths.
Cancer, heart disease and pneumonia together accounted for 42.7 percent of all deaths. Sepsis rose two places to eighth, while hypertensive disease and liver disease each fell one spot to ninth and tenth, respectively.
Among cause-specific mortality rates, cancer was the highest at 177.1 per 100,000, followed by circulatory system diseases at 136.6, respiratory diseases at 94.8, external causes of disease and death at 57.1, nervous system diseases at 43.9, and digestive system diseases at 28.7.
Compared with the previous year, the sepsis mortality rate rose 13.5 percent, Alzheimer's disease 12.1 percent, hypertensive disease 5.6 percent, and diabetes 3.2 percent. Suicide and transport accident mortality rates fell 4.7 percent and 4.5 percent, respectively.
Compared with a decade ago, the sepsis mortality rate jumped 187.6 percent. Alzheimer's disease rose 171.7 percent, pneumonia 110.4 percent, and hypertensive disease 71.7 percent. Over the same period, transport accident mortality fell 40.6 percent, respiratory tuberculosis 38.2 percent, and chronic lower respiratory disease 16.7 percent.
90,000 cancer deaths; dementia and sepsis mortality burden grows
Cancer claimed 90,203 lives last year, representing 24.9 percent of all deaths. The cancer mortality rate was 177.1 per 100,000, up 2.8 (1.6 percent) from the previous year.
Among cancer types, lung cancer had the highest mortality rate at 38.9 per 100,000, followed by liver cancer at 20.4, colorectal cancer at 19.1, pancreatic cancer at 17.0, and stomach cancer at 13.7. Pancreatic cancer mortality rose 6.2 percent from the previous year, while lung and breast cancer each rose 2.3 percent, prostate cancer 1.8 percent, and colorectal cancer 0.9 percent.
Among men, lung cancer had the highest mortality rate at 58.2 per 100,000, followed by liver cancer at 30.1 and colorectal cancer at 21.7. Among women, lung cancer also ranked first at 19.8, followed by colorectal cancer at 16.6 and pancreatic cancer at 16.3.
The overall cancer mortality rate for men was 219.9 per 100,000, 1.6 times the female rate of 134.7. The gender gap was widest for esophageal cancer at 7.3 times, followed by lung cancer at 2.9 times and liver cancer at 2.8 times.
The circulatory system disease mortality rate was 136.6 per 100,000, up 1.4 percent from the previous year. The breakdown showed heart disease at 66.3, cerebrovascular disease at 48.7, and hypertensive disease at 17.0.
Compared with the previous year, hypertensive disease mortality rose 5.6 percent, cerebrovascular disease 1.0 percent, and heart disease 0.9 percent. The overall circulatory system disease mortality rate was higher for women at 140.3 per 100,000 than for men at 132.7. However, ischemic heart disease mortality was higher among men at 32.7 per 100,000, compared with 22.2 for women.
Pneumonia killed 30,965 people, accounting for 8.5 percent of all deaths. The mortality rate was 60.8 per 100,000, up 1.8 from the previous year. Pneumonia climbed from fourth to third among causes of death since 2015.
Dementia-related deaths totaled 16,321, up 9.0 percent from the previous year. The dementia mortality rate rose 2.7 to 32.0 per 100,000, a 9.2 percent increase. The female dementia mortality rate was 43.2 per 100,000, 2.1 times the male rate of 20.7.
Looking at Alzheimer's disease alone, deaths numbered 13,674 with a mortality rate of 26.8 per 100,000. Alzheimer's disease has risen from 11th to 6th among causes of death since 2015.
Sepsis killed 8,754 people, with a mortality rate of 17.2 per 100,000. The sepsis mortality rate rose 13.5 percent from the previous year, pushing it from 10th to 8th in the cause-of-death rankings.
Alcohol-related deaths totaled 4,841, up 18 from the previous year, with an average of 13.3 alcohol-related deaths per day. The mortality rate was 9.5 per 100,000, up 0.6 percent. The male mortality rate of 16.0 was 5.2 times the female rate of 3.1.
COVID-19 deaths fell to 1,096, down 2,112 (65.8 percent) from the previous year, accounting for 0.3 percent of all deaths. The COVID-19 mortality rate also dropped 65.8 percent, from 6.3 to 2.2 per 100,000. People aged 80 and older accounted for 71.6 percent of COVID-19 deaths.
Maternal mortality ratio rises 28.8%, exceeds OECD average
Infant mortality indicators improved. A total of 512 infants died within one year of birth, down 52 from the previous year. The infant mortality rate fell 14.9 percent to 2.0 per 1,000 live births, below the OECD average of 4.1.
The leading cause of infant death was certain conditions originating in the perinatal period, which accounted for the largest share at 49.8 percent. Congenital malformations, deformations and chromosomal abnormalities accounted for 15.8 percent, and symptoms, signs and abnormal clinical and laboratory findings not elsewhere classified accounted for 15.0 percent.
Perinatal deaths — combining fetal deaths at 28 weeks or more of gestation and neonatal deaths within seven days of birth — totaled 591, up 45 (8.2 percent) from the previous year. Of these, 423 were fetal deaths at 28 weeks or more and 168 were neonatal deaths within seven days of birth.
The perinatal mortality rate was 2.3 per 1,000 total births, up 1.4 percent from the previous year, though still below the OECD average of 5.4.
Maternal mortality indicators, however, worsened. Thirty-three women died from pregnancy- or childbirth-related causes, up nine (37.5 percent) from the previous year. Direct obstetric deaths — caused by conditions such as obstetric embolism or postpartum hemorrhage — rose by 10 to 27, a 58.8 percent increase.
The maternal mortality ratio stood at 13.0 per 100,000 live births, up 2.9 (28.8 percent) from the previous year and above the OECD average of 10.9.
By region, South Jeolla Province had the highest crude death rate at 1,117.2 per 100,000, followed by North Gyeongsang Province at 1,040.0 and North Jeolla Province at 1,005.8.
In terms of the age-standardized mortality rate, North Gyeongsang Province was highest at 320.8 per 100,000, followed by North Chungcheong Province at 316.5 and South Gyeongsang Province at 316.1. Seoul was lowest at 242.7, followed by Sejong at 261.4 and Gyeonggi Province at 270.0. The age-standardized mortality rate fell from the previous year in all 17 cities and provinces.
Among cause-specific age-standardized mortality rates, Gwangju had the highest cancer rate at 86.5 per 100,000. Ulsan recorded the highest heart disease rate at 31.6, North Gyeongsang Province the highest pneumonia rate at 27.7, and North Chungcheong Province the highest cerebrovascular disease rate at 22.4.
Jeju had the highest age-standardized suicide rate at 30.3 per 100,000, while Sejong had the lowest at 16.6. Daegu had the highest Alzheimer's disease rate at 14.6, and Busan had the highest diabetes rate at 12.5.
If you're thinking about self-harm or suicide, dial the Suicide Prevention Hotline at 109, available 24 hours a day, seven days a week. Please request a translator for English-language services.
fact0514@heraldcorp.com