- Korea Institute of Energy Research develops map-based integrated renewable energy analysis tool
- Platform calculates installation capacity, electricity savings and payback period
- Simulation projects 13,000-ton annual carbon cut, 155.9 billion won in economic benefits over 20 years
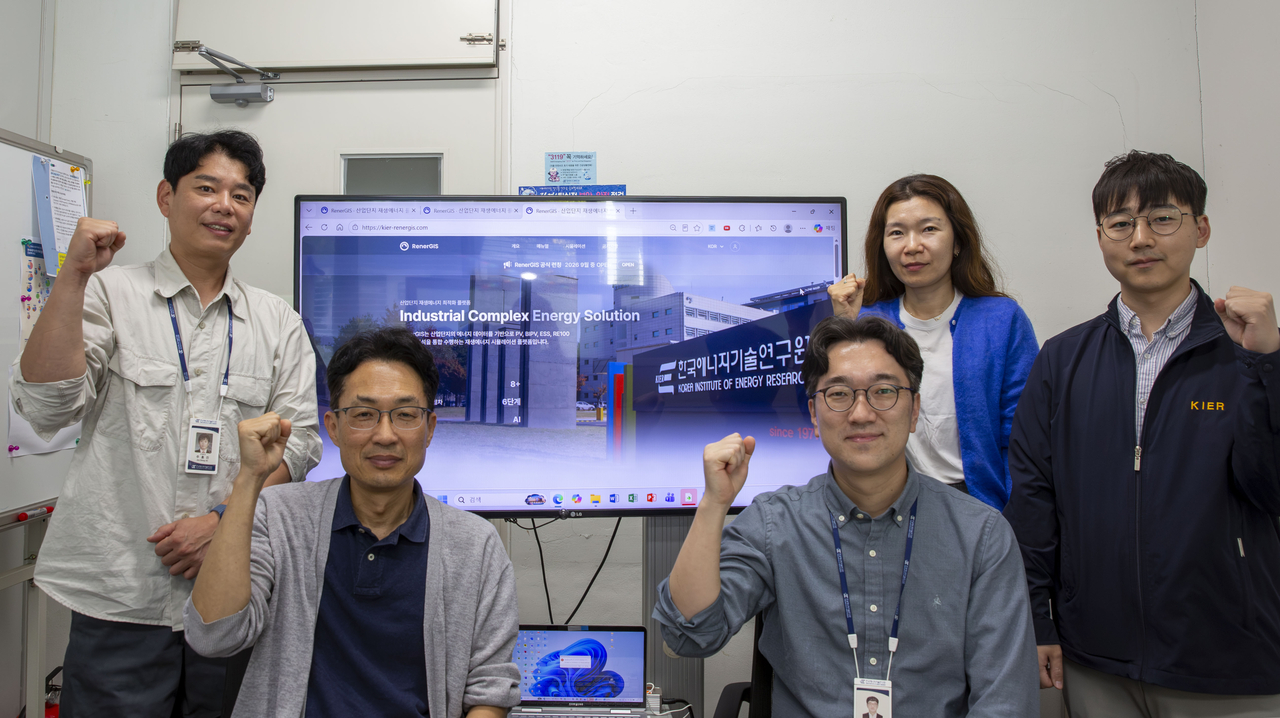
How many solar panels can fit on a factory roof? What size energy storage system would best cut electricity costs? Korean researchers have developed a tool that answers both questions at once — users simply select a factory on a map and the platform automatically calculates solar power output, electricity savings and investment payback period.
The Korea Institute of Energy Research announced Thursday that a research team led by Kim Jong-gyu of its New and Renewable Energy Systems Laboratory has developed RenerGIS, a web-based design platform that provides integrated analysis of the feasibility and economic viability of introducing renewable energy at industrial complexes.
Industrial complexes consume large amounts of electricity due to the high concentration of factories. Expanding renewable energy installations such as solar panels is essential for companies seeking to achieve RE100 — the goal of sourcing all electricity from renewable energy.
The challenge is that factories vary widely in building size, power consumption and operating hours, making it difficult to determine the right scale of equipment. Previously, building data, weather information and power usage figures had to be collected separately, and power generation and economic viability each required dedicated software to analyze.
RenerGIS integrates all of these steps into a single digital map.
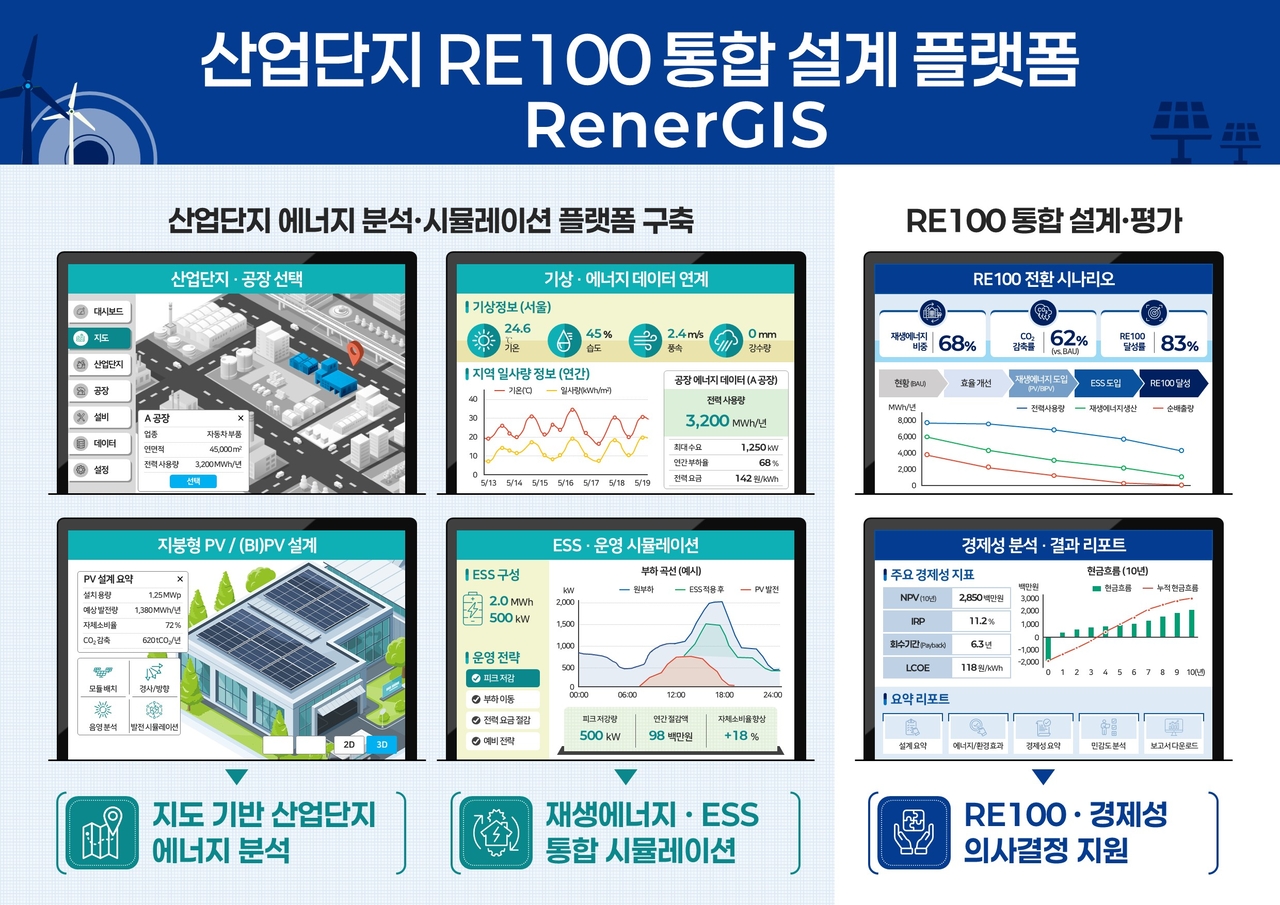
When a user selects a factory on the map, local weather data are applied automatically and hourly, daily and monthly power consumption patterns are generated. The user can then specify the type, tilt angle and orientation of solar panels, and the platform calculates the installable capacity on the roof along with annual power generation.
The platform also optimizes ESS operation. It analyzes how much electricity costs can be reduced by storing power during off-peak hours and drawing on it during peak-rate periods.
By entering solar and ESS installation and operating costs, users can also view economic indicators including payback period, net present value and internal rate of return.
The analysis process consists of six steps: selecting a building, setting weather conditions, configuring equipment, running a simulation, assessing economic viability and reviewing results. Because the entire process runs through a guided web interface without any specialized software, the platform can be used not only by companies but also by local governments and industrial complex management agencies.
The research team ran an energy transition simulation using RenerGIS on a domestic industrial complex.
The results showed that the RE100 conversion rate would rise by 5.89 percentage points. Annual carbon emissions were projected to fall by about 13,000 tons, and cumulative economic benefits over the next 20 years were estimated at 155.9 billion won ($118 million).
These figures are simulation results, not measured outcomes from actual installations, and further verification through real-world application will be needed.
The team plans to expand the platform to incorporate a wider range of renewable energy systems beyond solar and ESS, and to scale up demonstration projects at actual industrial complexes.
"The significance lies in making it easy to assess the renewable energy potential of industrial complexes and individual factories on a map, and to analyze installation capacity and economic viability all within a single platform," Kim said. "We will expand real-world application at industrial complexes and verification using field data to develop this into a national-level renewable energy design platform."
nbgkoo@heraldcorp.com