'Population is key administrative data showing a city's present and future'
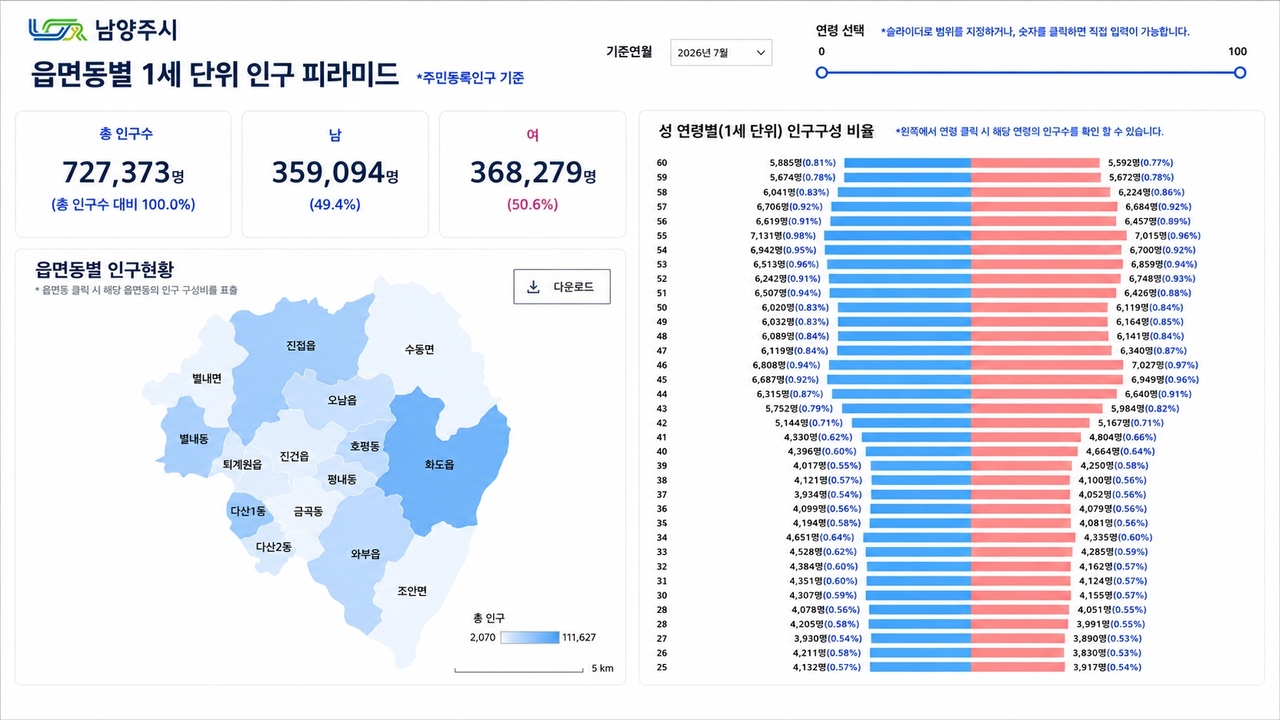
Namyangju has upgraded the population analysis function on its integrated data platform, adding a service that lets residents examine the city's demographic makeup in single-year age increments.
The city said Wednesday it has built a new dashboard that breaks down population composition ratios by single-year age groups, allowing more detailed analysis than was previously available. The tool draws on resident registration data to let users check the city's gender and age structure at a glance.
The dashboard displays total population figures alongside gender-specific counts and composition ratios, and visualizes the gender-age breakdown as a population pyramid.
A sliding bar lets users select any age range from newborns to those 100 and older, enabling more targeted demographic queries.
The upgrade also strengthens spatial analysis by overlaying population composition data on a map of the city's towns, townships and neighborhoods, making it easier for residents to explore the demographic profile of their own area.
The city said the improvements go beyond simply providing statistics, and that it plans to expand a data-driven administrative environment in which residents can directly track population changes and draw on the information for their own lifestyle and policy needs.
Baek Hui-jin, head of the Smart City Division, said population data is "critical administrative data that reveals a city's present and future," adding that the city will continue to enhance the analytical capabilities of the integrated data platform so residents can access and use the information they need easily and conveniently.
The service is accessible through the big data visualization dashboard section of the Namyangju integrated data platform, under the monthly population trends menu for single-year age composition ratios.
pjh@heraldcorp.com